


CODESYS Visualization
Creation of professional visualization screens directly in the PLC programming environment CODESYS Development System – displayed on a target device, a PC or a web browser.
NEW: CODESYS Visualization Series
Welcome to a new video series about CODESYS. Over the next few weeks, we will be taking a closer look at various topics relating to CODESYS Visualization. The first video will give you a brief overview of the topics covered in the video series.
We recommend using CODESYS V3.5 SP19 Patch 4 or higher and the CODESYS Visualization add-on in version 4.4.0.0 or higher.
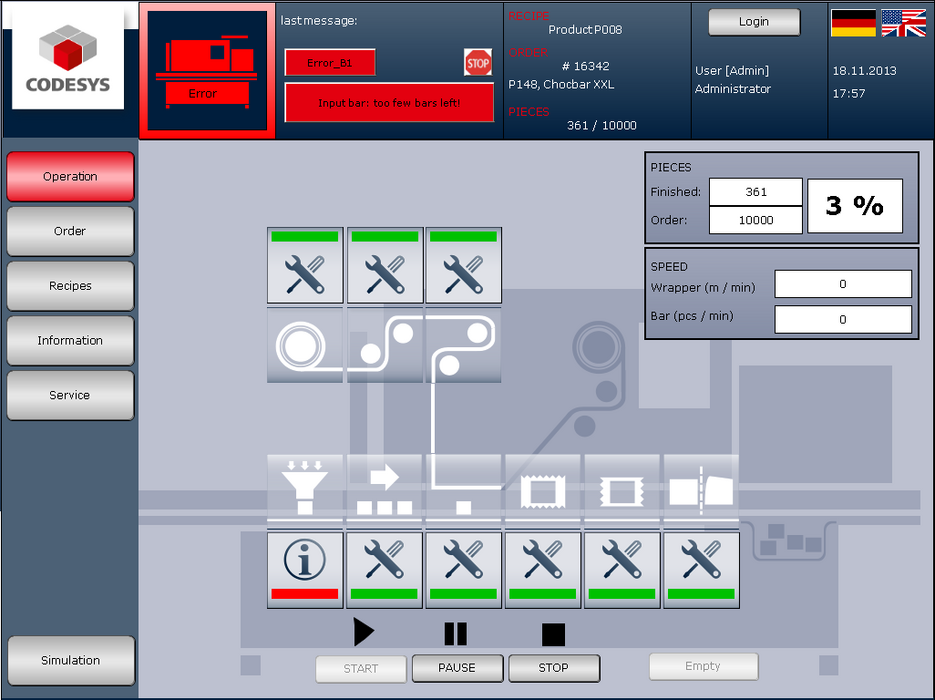
Visualizations enable the convenient operation and monitoring of industrial machines of all kinds. They display digitized system data in such a way that it can be intuitively recorded and processed: during commissioning of machines and systems, operation, maintenance and service, monitoring, and programming of logic controllers.
CODESYS Visualization makes it easy for you to create clear and convenient operating and monitoring interfaces - along with maximum degrees of freedom:
- For any control system (may or may not be compatible with CODESYS)
- For machines and systems in factory automation, in mobile machines, in the automation of processes, buildings, systems for energy generation, storage, and distribution
- For display on PCs, on panel controllers, or in HTML5 browsers - based on a single project
- For project planning as a stand-alone task or in parallel with the logic application
- Optimized for operation with different application icons, design concepts or display sizes, in different languages, etc.
The highlights
Multifunctional project planning tool
- Creation of SCADA/operator screens with a convenient editor
- Access to control data via OPC UA / OPC DA and a lean, proprietary interface
- If required: programming of logic controllers in accordance with IEC 61131-3 and direct access to their variables as well as other integrated automation functions, such as I/O and fieldbus configuration, motion control, or safety applications
- Easily configurable user interface as a pure HMI tool or multifunctional automation interface
Simplified engineering thanks to parallel use of the project planning tool for logic applications
- No need for synchronization of tag lists due to integration in the IEC 61131-3 tool
- Direct access to all application variables
- Simultaneous monitoring of application and visualization
Multiple use of visualizations for different tasks
- Visualization screens for machine/system operation
- Convenient user interfaces for testing and commissioning
- Supervision for monitoring and coordinating one or more machines/systems
Display and operation on different visualization clients with the same database for flexible use in the application environment
- Directly in the project planning tool
- On the panel control (with built-in or connected display)
- In the Internet browser (on PCs, tablets, and smartphones with HTML5), connected to the control unit
- On remote PCs, connected to the control unit
- Simultaneously on several client platforms, if required
Extended functionality thanks to the integration of visualization and IEC 61131-3 programming software, e.g.
- Powerful "FB instances" of visualizations for object-oriented use
- Convenient array access from the visualization
- Simple recording of real-time data
- Immediate expandability of the pool of visualization elements
- Calling PLC functions from the visualization
References
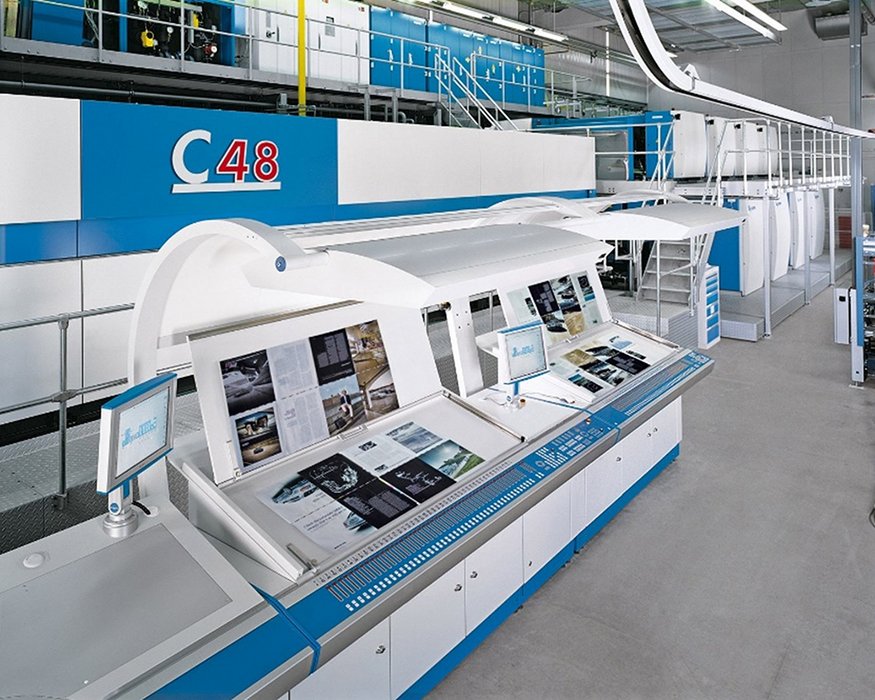
- Factory Automation: For operating and monitoring machines and systems, e.g. in the production of furniture, automotive components, packaging, etc. Examples: HOMAG, Robert Bosch ...
- Mobile automation: For operating construction or agricultural machinery, industrial compressors or diesel generators, as well as in shipbuilding Examples: Goldhofer/Trepel, ...
- Process automation: As a process control system for sheet metal or paper processing, for operating sewage treatment plants and chemical processes Examples: MP Services, Danieli
- Energy Automation: As a control center for the control and monitoring of solar power plants, for the extraction of crude oil/coal, for the storage and transportation of energy Examples: Solar park in Spain, control of crude oil production with Elesy...
- Building automation: For monitoring units, building control systems, access control systems
Example: ADAC building in Munich, CODESYS headquarters in Kempten
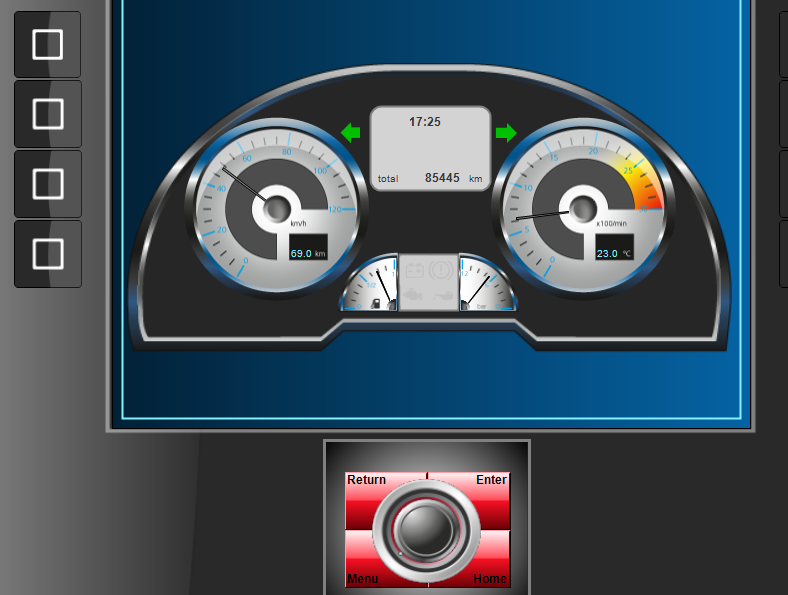
Practice-oriented controls (operating elements)
With functionally complex but easy-to-use visualization elements, you can create modern and professional visualization interfaces in no time at all. Generic elements are also available, which you can flexibly adapt to your requirements. You can easily integrate available HMTL5 objects and animate them using the production data.
Simple integrated project planning
You can animate your visualization elements based on the variables of production data with just a few mouse clicks - simple movement, gesture control, or even multi-touch function. For a project comparison of the masks/images created in this way with other projects on the hard disk, it just takes one mouse click.
Fast connection to any control platform
Create visualizations for any controllers via OPC UA. Browse the available variable space and make your own variables available to other platforms in the Industry 4.0 environment via OPC UA server. Or work conveniently with variables from a CODESYS logic application without having to integrate external data. In addition, a convenient and lean API is available for data connection.
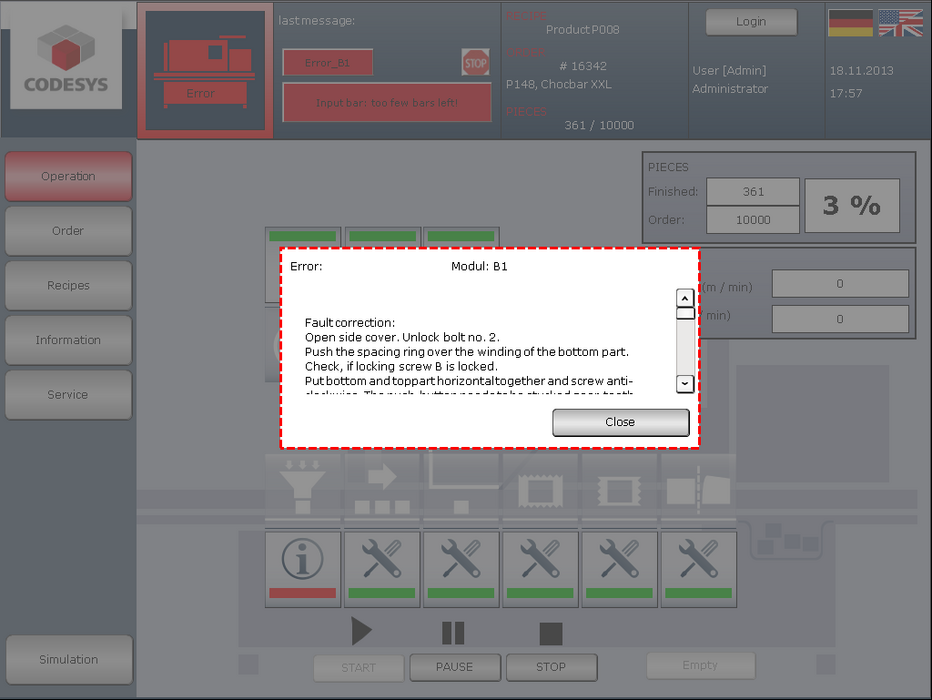
Integrated alarm management
Based on the PLC variables, you can classify critical states for production, machine, or operation into classes, groups, and types, display them within the CODESYS Visualization and react to them. If required, you can also do this for several visualized controllers at the same time.
Secure thanks to sophisticated user administration
You can conveniently manage all user interfaces down to individual visualization elements based on access rights for individual users or user groups - including functions for login, password management, and user management in online mode.
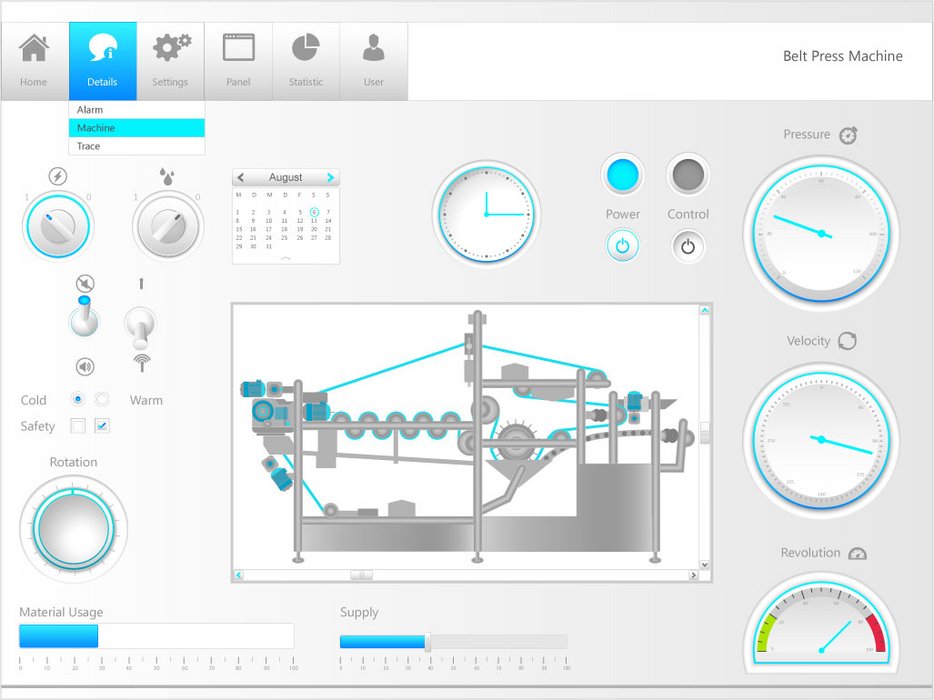
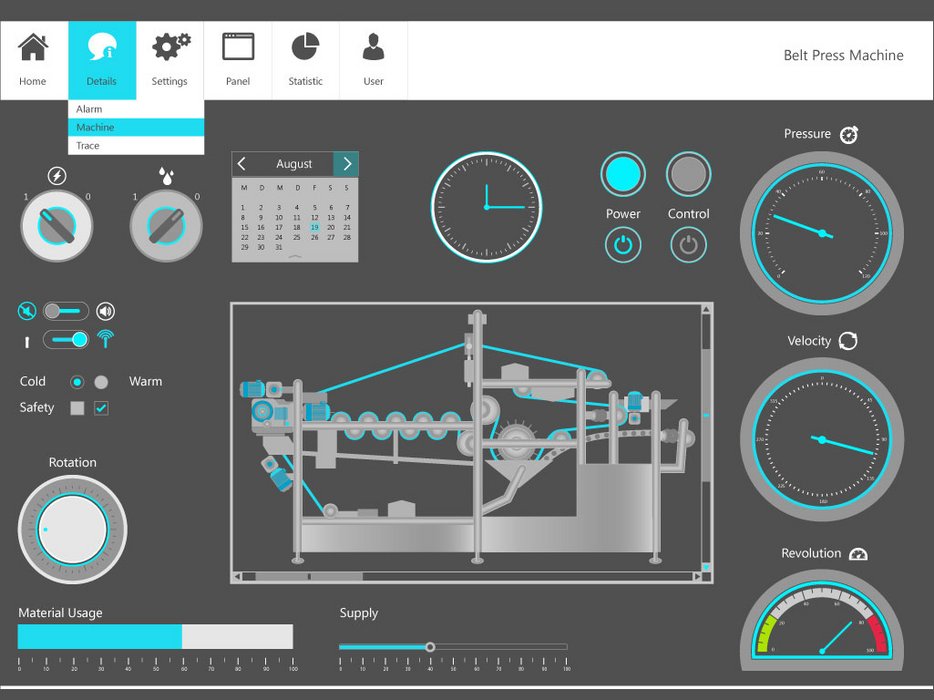
Convenient switching of styles
Store the graphic information of your visualization elements and pages in style definitions. By switching the style, you can adapt the entire project to the look and feel that your customers expect at a mouse click.
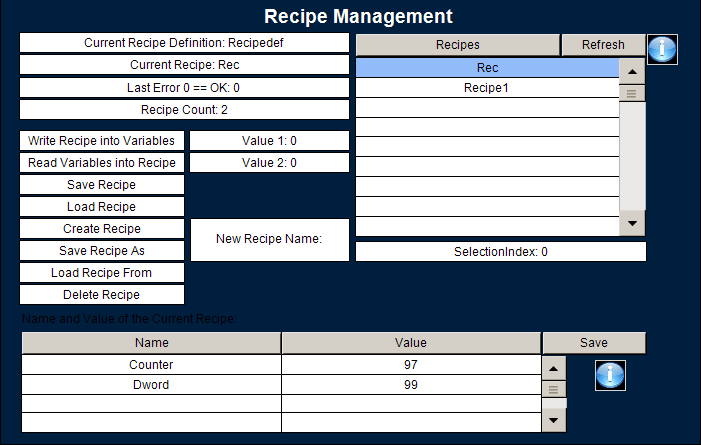
Smart reusability
Store complete visualization pages in libraries and reuse them - the parameter interface makes the visualization objects you created as flexible as IEC 61131-3 function blocks. If required, you can even bring such visualization libraries to market within the community.
Switching languages, images, and units
You can manage images and texts in lists. You can reference / embed existing images such as pixel graphics (JPG, PNG, GIF etc.) or vector files (SVG) and use them to create user interfaces. You can therefore conveniently access the fixed and dynamically stored elements. Text lists can be made available to external employees for translation via export/import. The visualization can be translated and displayed in all languages using Unicode data format. Along with language switching, you can also convert units automatically - e.g. for entering and displaying values in different regions.
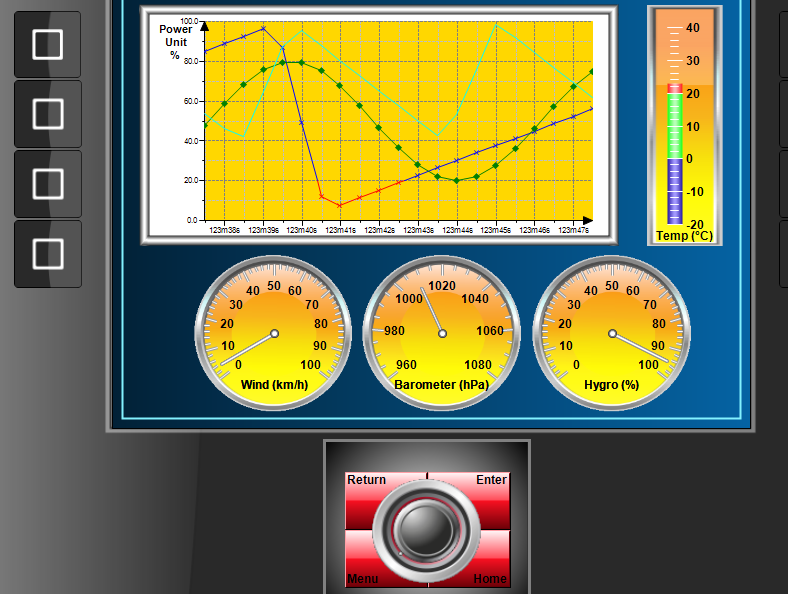
Lean modules for data recording
For a quick overview: Record the process data of your machine or system using the trace, histogram, or trend function.
Flexible and secure communication concept
Thanks to the simple integration of data sources from different devices, several controllers can be visualized in one project, or the pages of a project can be visualized on several display devices. Communication between the controllers and to the visualization can be encrypted via X.509 certificates and thus protected against unauthorized access - especially when used in Industry 4.0 environments.
Available products and display variants
Available Clients
- CODESYS WebVisu
The web browser communicates with the web server in the controller via JavaScript (with TLS encryption if required). It offers an optimized display of the visualization via responsive design using HTML5 canvas elements. This technology is supported by practically all browsers and is therefore also available for iOS and Android. - CODESYS TargetVisu
A driver for a built-in or connected display turns the controller itself into a client: control and visualization on a single device. - CODESYS HMI
A portable client enables the visualization images to be displayed on remote display devices, e.g. under Windows or Linux. - Integrated web client in the CODESYS Development System programming environment, e.g. for tests or for service or diagnostic purposes with online connection to the controller

If you integrate CODESYS into systems or use it in mechanical or plant engineering:
Prerequisites:
- Use in parallel with logic programming in accordance with IEC 61131‑3:
Use a controller programmable device with CODESYS (e.g. from the "CODESYS Inside" list) or a SoftPLC for standard device platforms from the CODESYS Store - Use as an independent visualization for any control platform:
Use a controller with integrated OPC UA server/client and CODESYS HMI as a display client.
Engineering in the visualization editor of the CODESYS Development System:
- Design of user interfaces (visualizations) in HMI view or parallel to logic programming
- Operation of the control system using the integrated client, e.g. during application tests or commissioning
- The CODESYS Development System can be used free of charge. You do not need an additional license for engineering.
Display of the visualizations you created on a remote PC: Licensing of CODESYS HMI.
- One license is required per PC workstation. The number of variables that can be displayed can be extended with additional licenses.
- A demo version is included in the setup of the CODESYS Development System.
- The full version of CODESYS HMI is licensed in the CODESYS Store.
Display on panel control with the integrated CODESYS TargetVisu:
- Display on internal or connected displays, e.g. from panel controls
- The visualization license can be purchased for SoftPLC systems in various expansion stages in the CODESYS Store.
Display via CODESYS WebVisu:
- Display on any HTML5 browser in the network
- The visualization license can be purchased for SoftPLC systems in various expansion stages in the CODESYS Store.
If you manufacture programmable devices:
- Implement the CODESYS Control runtime system with the CODESYS TargetVisu or CODESYS WebVisu options on your device.
- Consulting, offers, and further information at sales @codesys.com.


Part 2/9: Sample project and visualization from Scratch
In this video you will get an overview of the sample project which accompanies the video series and contains the features shown. In addition, a visualization project is created from Scratch.
We recommend using CODESYS V3.5 SP19 Patch 4 or higher and the CODESYS Visualization add-on in version 4.4.0.0 or higher.
CODESYS brochures and information material
|
CODESYS - One software. All applications. Your Automation Solution.
Version: 10/2023
|
pdf
2 MB
07.11.2023
|
|
|
CODESYS - One software. Any field of application. Your automation platform.
Version: 10/2023
|
pdf
2 MB
07.11.2023
|
|
|
Various suppliers present CODESYS-compatible devices and exciting solutions that can be useful for your automation tasks. (Only available in german language.)
Version: 11/2022
|
pdf
3 MB
04.11.2022
|